Difference between revisions of "Quick Starter Guide - Reports"
From FPDS-NG
| Line 1: | Line 1: | ||
| − | <table width=100% style="border: 2px solid #1860ac; color: #000; background-color: # | + | <table width=100% style="border: 2px solid #1860ac; color: #000; background-color: #FFFFFF; clear:both;"> |
<tr><td> | <tr><td> | ||
==FPDS-NG ADHOC REPORTING TOOL== | ==FPDS-NG ADHOC REPORTING TOOL== | ||
Revision as of 15:27, 29 May 2009
Contents
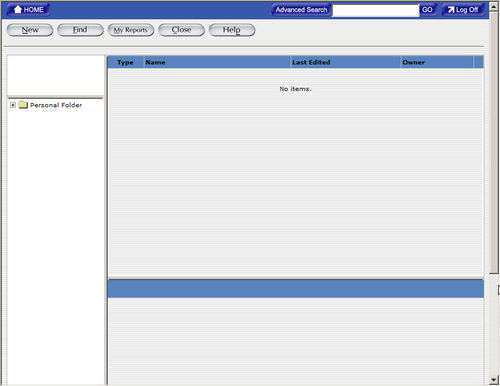
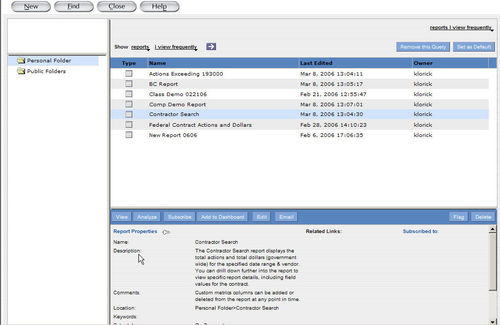
FPDS-NG ADHOC REPORTING TOOLIntroductionThis section specifies instructions for creating reports based on your selected criteria. Agencies/Companies can create reports that answer their business questions and analyze processes. FPDS-NG uses the Informatica, Power Analyzer tool to create custom reports. Users have the option to save customized queries and reports in a personal folder specific to their User ID. Adhoc Reporting FeaturesSelecting Ad Hoc will display the query panel and standard tool bar. The Ad Hoc Reporting Screen contains a personal folder where saved queries are stored specific to the user’s ID. The following screen will display when the user opens Adhoc for the first time using the Informatica tool. CREATING AN ADHOC QUERYAdhoc reporting is a user friendly feature designed for all levels of users. Custom reports are created using queries. A query is one or more statements that request data from a database. If the data is available, then the requested data returns in the form of a table which contains rows and columns that create a report. Queries are sent to the databases in a language called SQL. However, when using the Report Panel, SQL knowledge is not required. New and Find ButtonThe New button displays a new screen that allows you to create analytic reports from the FPDS-NG data by using a query. A report consists of a set of related metrics and attributes. The queries are based on metrics, attributes filters specified by the user in the report. When a new report is generated, Ad Hoc displays the queries from the database. You can modify the data and the format of a report. The Find button allows you to access your personal folder from other screens in Adhoc. Any saved queries you have will be stored in your personal folder. To access the new report screen in Adhoc
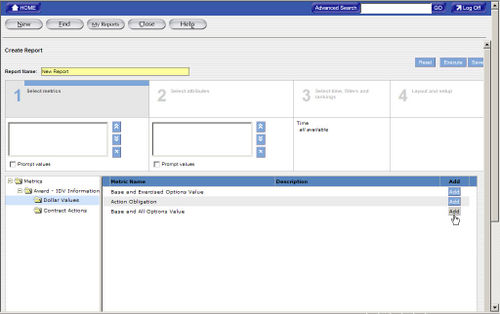
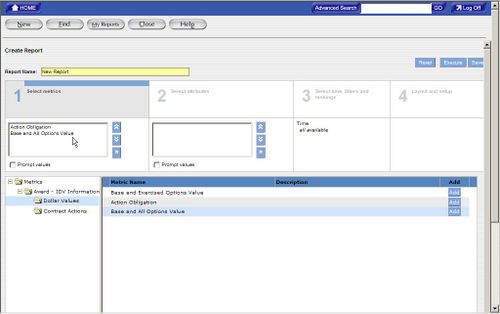
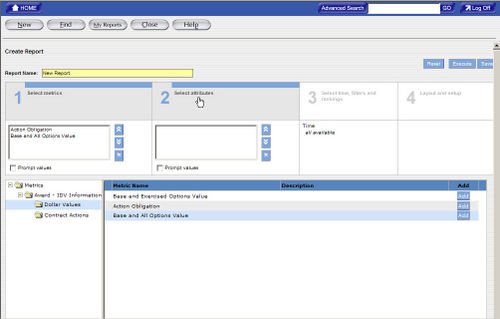
The Create Report screen is used to select and enter analytical information for a report. This screen is divided in to four sections designed to create a query for a report. To Create a New Report in AdhocThe first step in creating a report is specifying the data for the report. Section 1 Selecting Metrics adds the measures to evaluate a business process. Metrics are always numeric values. For example, Dollars Obligated, Actions Count, and Base and All Options Value are metrics that provide measurable information used to determine trends in federal spending.
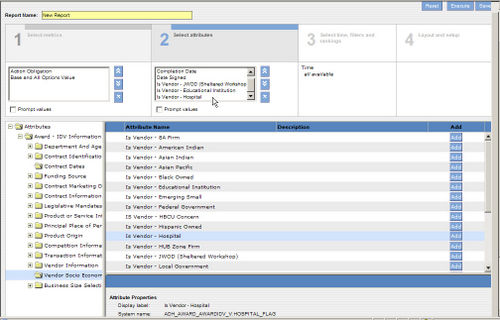
To Select Attributes for a New ReportAttributes are the factors that determine the value of a metric. For example, Date Signed, Product Services Codes, and Contracting Office Names are attributes. If you want to create a report that tracks Dollars Deobligated and Total Actions for a specific agency, you need to identify attributes that determine the values of these metrics.
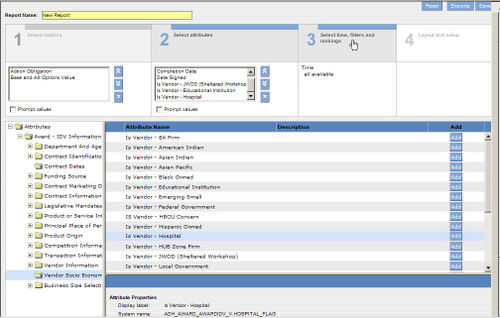
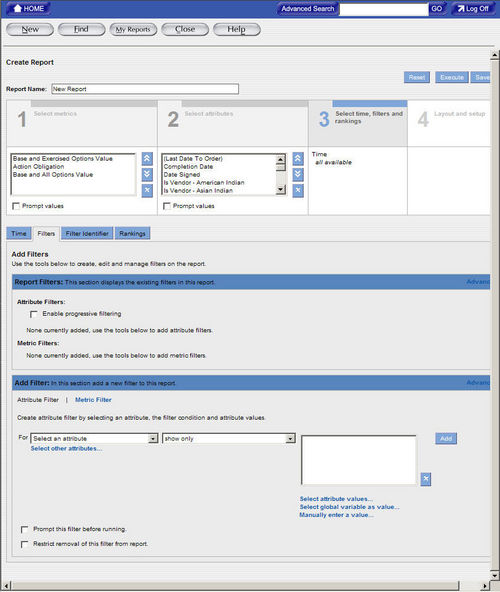
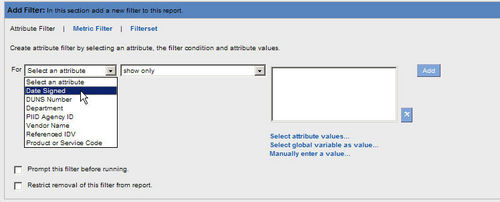
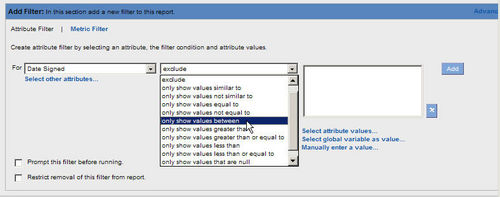
To Create Filters on a New ReportYou can use a filter in your report to set a range for the report data. When creating a report, a range is used to limit the search of the query to your specifications. This range depends on the business question that you want answered.
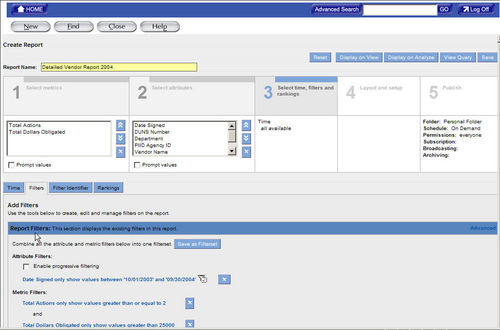
To Updating Filters on a new or existing reportFilters are stored under the Report Filter Section in section 3 Select Time, Filters, and rankings. Use the following steps to update Attribute and Metric Filters.
To Save a ReportWhen a query is created the information can be saved and used again when needed. You can save the query after adding filter information. Use the following steps to save report queries.
To Generate a ReportAfter adding the report filters and ranges the report can be generated. To keep changes made to the query select save or generate the report and save the query from the displayed report screen.
To Format the ReportThe final step in creating reports is selecting the formatting for the report. Section 4 Layout and Setup is used to customize the visual display of your report. Calculations can be added for metric filters in the report. You can also modify the date formats, display, and fonts in the report. Use the following steps to format a report.
Creating sections in a report will display the report divided by the attribute you have chosen. For example, choosing the funding agency ID will display the report information in sections for each ID.
You select formats for metrics and attributes on the Formatting tab. These formats determine how the metrics and attributes display in the report table.
The save as function will allow you to make changes to the query and save the changes without overwriting the original query.
DRIILING DOWNDrill Down FeatureThe drill feature provides other attributes or metrics at a lower level related to the current report that is displayed. The following section Drilling into a Report explains how to shift from a general view of the report data to a more detailed view using the drill down feature. Drilling into a Report When drilling into a report, attribute or metric values are selected for the drill. The reporting tool uses these values as a drill filter. The drill filter determines the data seen in the drill results. More than one attribute or metric value for the drill can be selected. To Drill into a ReportTo drill into a report:
-Or-
-Or- In the report table, right-click the selected values, and then click Drill to view available drill paths. You can select those attributes from the available drill paths that are not already part of the report. Each attribute can have one primary drill path and multiple secondary drill paths. The primary drill path allows you to follow a standard path of inquiry for the attribute.
For example, if the report currently displays the report government wide select the department attribute for “Homeland Security”, and then select the contracting Agency attribute to display the agencies (i.e. Coast Guard, Transportation Security Administration) for the selected department (Homeland Security). The report drill filter will show all agencies associated with “Homeland Security” for the reporting period.
Drilling into a Report with a Primary and Secondary Drill Path After the drill filter is created, additional attributes can be selected for the report. Drilling into a report allows you to filter attribute values and see additional attributes in reports. Additional attributes are selected from a predefined drill path. The predefined drill path lists the attributes that are available for selection to display in the report. The primary drill path allows you to follow a standard path of inquiry for the attribute. All other related drill paths appear in the report as secondary drill paths. The reporting tool displays both primary and secondary drill paths for all Metrics in a report. To Use Primary and Secondary Drill paths1) To drill using primary and secondary drill paths select an attribute value on the report. Right click on value and select drill. 2) To use a secondary drill path to filter further in to the report data right click on the Department “Homeland Security” and select drill. Select Vendor from the available drill path. Step 2 will select all Vendors associated with the Department of Homeland Security. This will display all Vendors for all Agencies as well. 3) To sort the Vendor results and look for Vendors with multiple entries use the sort button. When sorting by Vendor the report will allow you to find a vendor used more than once by an agency more efficiently. Drilling Using Two Primary Drill Paths Another drill feature available in the standard reports allows you to select from two primary drill paths. When a metric is used to filter the report two drill paths are available for selection. The first drill path filters by Contracting Agency level. The Contacting Agency drill path lists the selected drill filter by each agency. The second drill path filters by Department level. The Department drill path filters by grouping the selected drill filter for agencies. The following steps are provided to show how this concept works. To Use Two Primary Drill Paths
The report displays all vendor information for each agency shown in the following figure. To Select the Second Primary Drill Path
The report groups all vendor information and filters by the department level for each agency. HIGHLIGHTING METRIC VALUESYou can use colors, patterns, or symbols to highlight metric values in a report table. You can highlight metric values in a report that are above, below, or within a range. Highlighting allows you to draw attention to critical data in a report or pinpoint problem areas. If you highlight metric values in a report, the highlighting also appears in all bar charts you create for that report. In the charts the reporting tool displays highlighting as colored dots. Colored dots are a type of highlighting format. Creating a Highlighting Rule Specifying RangesWhen you create a highlighting rule, you specify three ranges (low, medium, and high) for the values that you want the reporting tool to highlight. You must enter numeric values that correspond to the values in the report table. These ranges must be in the ascending order. Highlighting RuleTo create a public highlighting rule, you must have write permission on the report. To create a personal highlighting rule, you must have read permission on the report. To Create a Highlighting Rule
Modifying a Highlighting RuleYou can modify the name, value ranges, colors, format, state, and user access of a highlighting rule. To modify a public highlighting rule, you must have write permission on the report. To modify a personal highlighting rule, you must have read permission on the report. To modify a highlighting rule:
Deleting Highlighting RulesWhen you delete a highlighting rule, the reporting tool deletes the highlighting from the report table and the highlighting rule name from the Highlighting task area. To delete a public highlighting rule, you must have write permission on the report. To delete a personal highlighting rule, you must have read permission on the report. To Delete a Highlighting RuleTo delete a highlighting rule:
ADDING METRICS TO AN EXISTING ADHOC REPORTTo Add Metrics to a ReportTo add a metric to an existing report:
To Add an Attribute to an Existing ReportTo add an Attribute to a report: Use the steps listed below to add an attribute to a report use:
To remove an attribute from a report, select the attribute you want to remove, and then click the Remove button.
The order of attributes in the report determines the order in which the attributes display in the report table on the Analyze tab.
When you display this report, the reporting tool prompts you to select the attributes you want to display in the report.
Attribute FilterYou can use global variables in attribute filters. A global variable holds any attribute value that you might want to use in a report filter. It allows you to have a different value for an attribute filter each time you run a report without changing the filter. To Create an Attribute FilterTo create an attribute filter:
The attribute list displays the attributes in the current report.
Or To use a global variable as a value, click Select Global Variable as Value. -Or- To manually enter an attribute value, click Manually Enter a Value. Enter an attribute value for the filter, and then click OK. Or Enter a value or values in the text box. Depending on the operator you selected the text box might display for the attribute values.
|
