You can filter the displayed values in reports to focus your analysis on specific values that interest you; for example a specific customer or sales period. You can apply report filters to reports in WebIntelligence documents created by yourself or by other users.
Report filters affect the values displayed in the report; they do not affect the data selection defined in the query. The data you filter out remains within the WebIntelligence document, it is simply not displayed in the report tables or charts. This means you can change or remove report filters in order to view other values, without modifying the query.
Applying filters to reports is especially useful if you want to view the data in a single WebIntelligence document in several different ways. For example, you can restrict the displayed data to values for a specific product line by applying a report filter to [Product line], and then switch to a regional or customer focus by removing the [Product Line] filter and applying new report filters to [Region] or [Customer].
Filtering a report to analyze sales of the accessories line in NY State
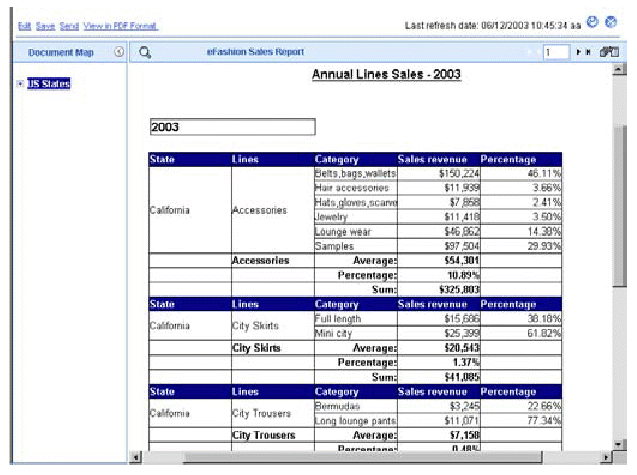
In this example, you receive a report that displays sales revenue by line categories for retail outlets in the US states. The query includes a filter for year, so that only values for 2003 are included in the document.

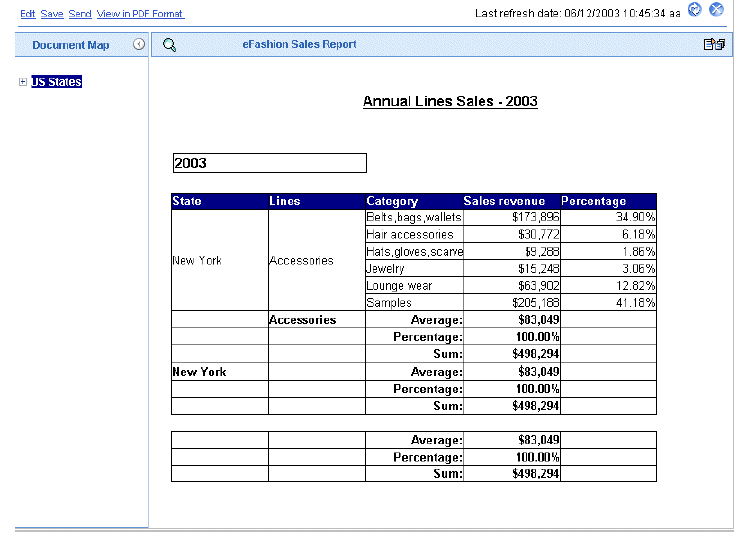
As Sales Manager for Accessories in New York State, you are only interested in analyzing revenue for the Accessories product line in New York. You define two report filters:
[State] Equal to NY
[Line] Equal to Accessories

When you run the report, WebIntelligence only displays values for the state and product line you specified in the filters.