You select how you want to display report values on the Report tab.
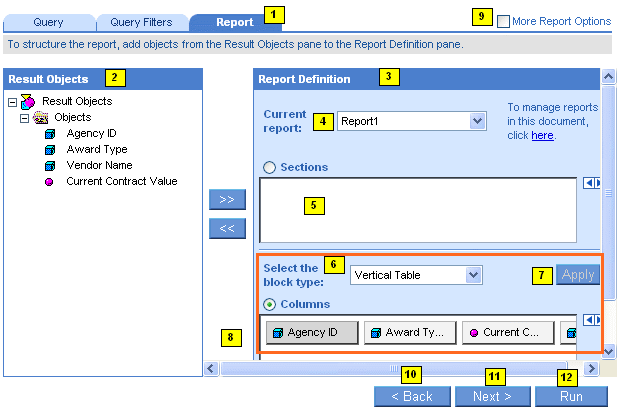
Report tab – this is where you choose a table or chart template and then allocate objects to specific areas on the selected template. You also create sections on this tab.
Result Objects pane – displays the objects included in the document.
Report Definition pane – define the structure of the report here.
Current Report – select a report here to define its data content and formatting.
Sections area – add objects to this area to create sections on the report.
Block type list box – select table and chart templates here.
Apply button – applies a selected table or chart template to the report data and allows you to reallocate the data to different table cells or chart axes as necessary.
Block preview – allocate objects to areas of the table, form, or chart here.
More Report Options – displays additional tabs to format the report and organize report data.
Back button – returns to the Query Filters tab.
Next button – advances to the Report Filters tab. (The Report Filters tab appears if you select the More Report Options check box.)
Run/Apply button – runs the query or applies modifications, and generates the report.