This section of the help file includes illustrations that will help you identify the different areas of charts you can format. Since not all chart types include all of the possible axes or legends, this section provides examples of the following chart types.
2D bar charts
3D bar charts
pie charts
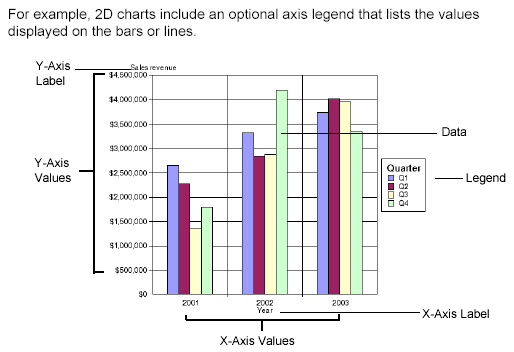
In this example, a 2D bar chart includes the optional Z-axis. Including data on the Z-axis enables you to show an additional break-down of the results displayed on the chart bars. The [Sales revenue] measure is on the Y-axis, the [Year] dimension is on the X-axis, and the [Quarter] dimension is on the Z-axis.
3D bar charts do not include an axis legend. You can clearly see what information is displayed on the chart bars by looking at the axis labels. The following example shows a 3D bar chart.
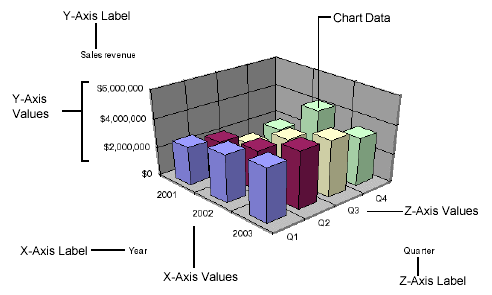
In this example, the chart bars display sales revenue per quarter, per year. The [Sales revenue] measure is on the Y-axis, the [Quarter] dimension is on the X-axis, and the [Year] dimension is on the Z-axis.
Pie charts have a single axis displayed on the body of the pie. This is the Y-axis.
Each segment of the pie chart displays a value for the measure on the Y-axis.
The pie chart legend indicates the dimension referred to by the measure.
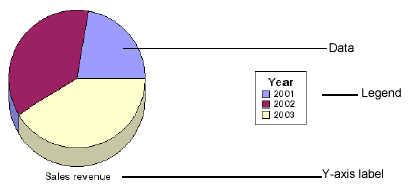
In this example, the 3D pie chart shows sales revenue per year. The measure on the Y-axis is [Sales revenue] and the dimension displayed on the legend is [Year]. Like 2D pie charts, 3D pie charts display measures for a single dimension.
The graphical design of 3D pie charts, however, gives a three dimensional appearance.