Make sure you are in Edit
mode and verify you are on the Format tab.
If the Format tab is not visible, check the More report options check
box.
A document can contain multiple reports. The name of the selected report
appears in the Current report dropdown list box.
Leave the displayed report
selected.
Or
Select a different report by clicking the arrow next to the Current
report dropdown list box, and then select a different report from the
list.
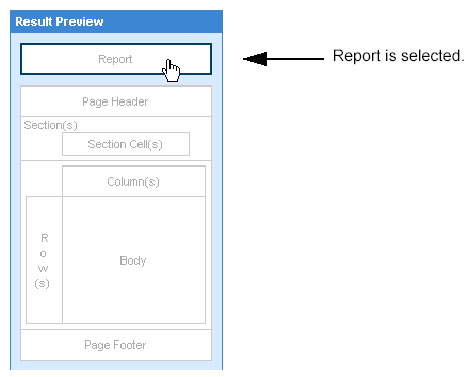
The Result Preview pane displays the structure of the report.
Click the Report area in the Result Preview pane.
The options for positioning the block are named according to whether
the block in the report is a table, crosstab, chart, or form.
For example, in the following illustration the block is a crosstab,
so the position options are labelled Crosstab.
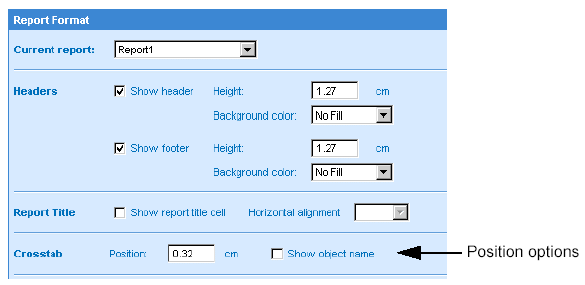
In the Position text box, type the distance you
want to position the block from the left of the report margin.
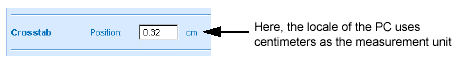
The measurement unit used for the position is specified in your locale.
Click Run, if you are generating the results for
the first time.
Or
Click Apply, if you have already generated the results once.
The position you specified is applied to the report block.